Understand your data by instantly creating charts and graphs
What is Omnitrack?
Omnitrack is a centralised reporting and tracking tool that replaces traditional, yet outdated data management processes such as emails, spreadsheets and long PDF and Word forms. It allows anyone to identify a risk, complete staff surveys or carry out reporting requirements. Compliance managers can then easily track and analyse incoming data. Collecting and storing data relating to all areas of compliance in a central portal adds structure, efficiency and transparency to the compliance process.
Why should you create reports?
So you’ve collected data from several supplier questionnaires you sent out and have exported the data to an Excel spreadsheet. Now what? How do you make sure that your organisation carries out any further action that is required?
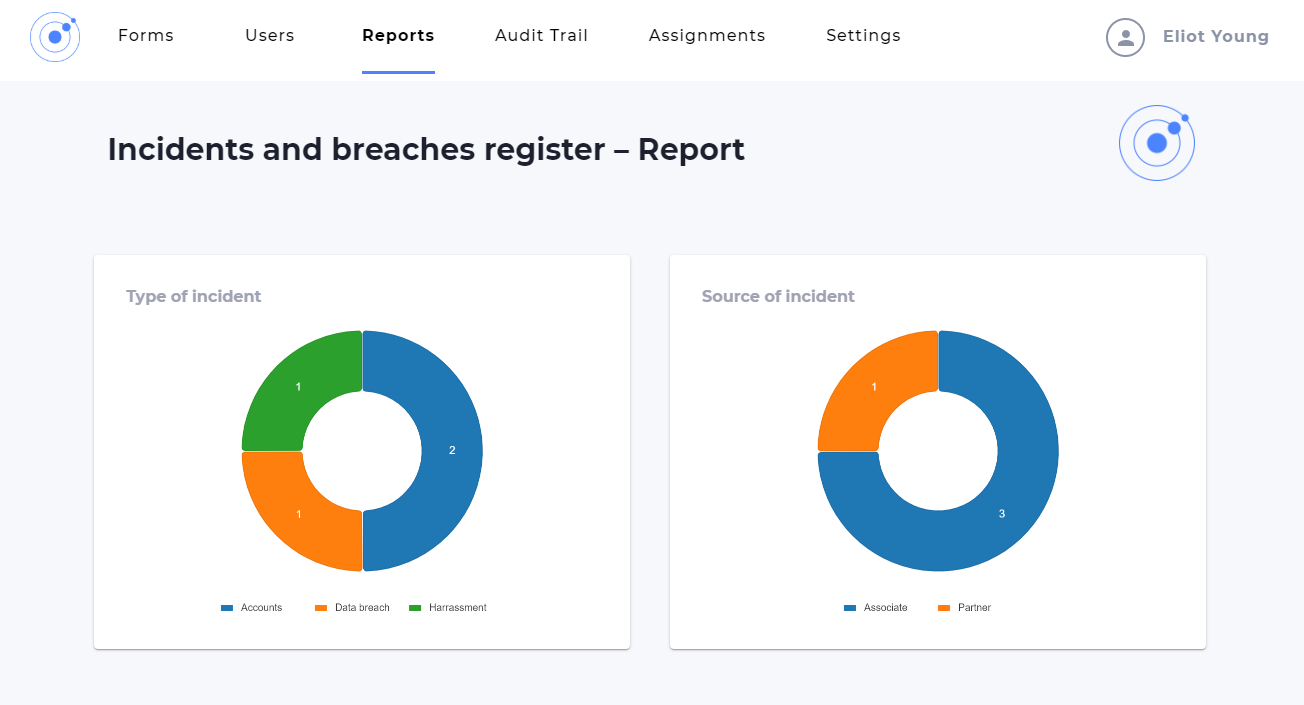
With Omnitrack, you can build charts and graphs within a matter of seconds to help you better understand your data, any improvements that need to be made to your organisation’s compliance procedures and any follow-up that may be required. The charts collect data in real time and can be exported to a PDF document so you can easily send the charts to colleagues or use them in internal reports.
What information can charts be used to analyse?
Here are some examples of what our clients create charts for:
- Data Protection Impact Assessments (DPIAs) – where does your organisation have to improve its data protection processes
- Keeping track of any further action that is required from incoming subject access requests
- Analysing all incoming whistleblower reports
- Understanding staff’s reporting requirements under DAC6
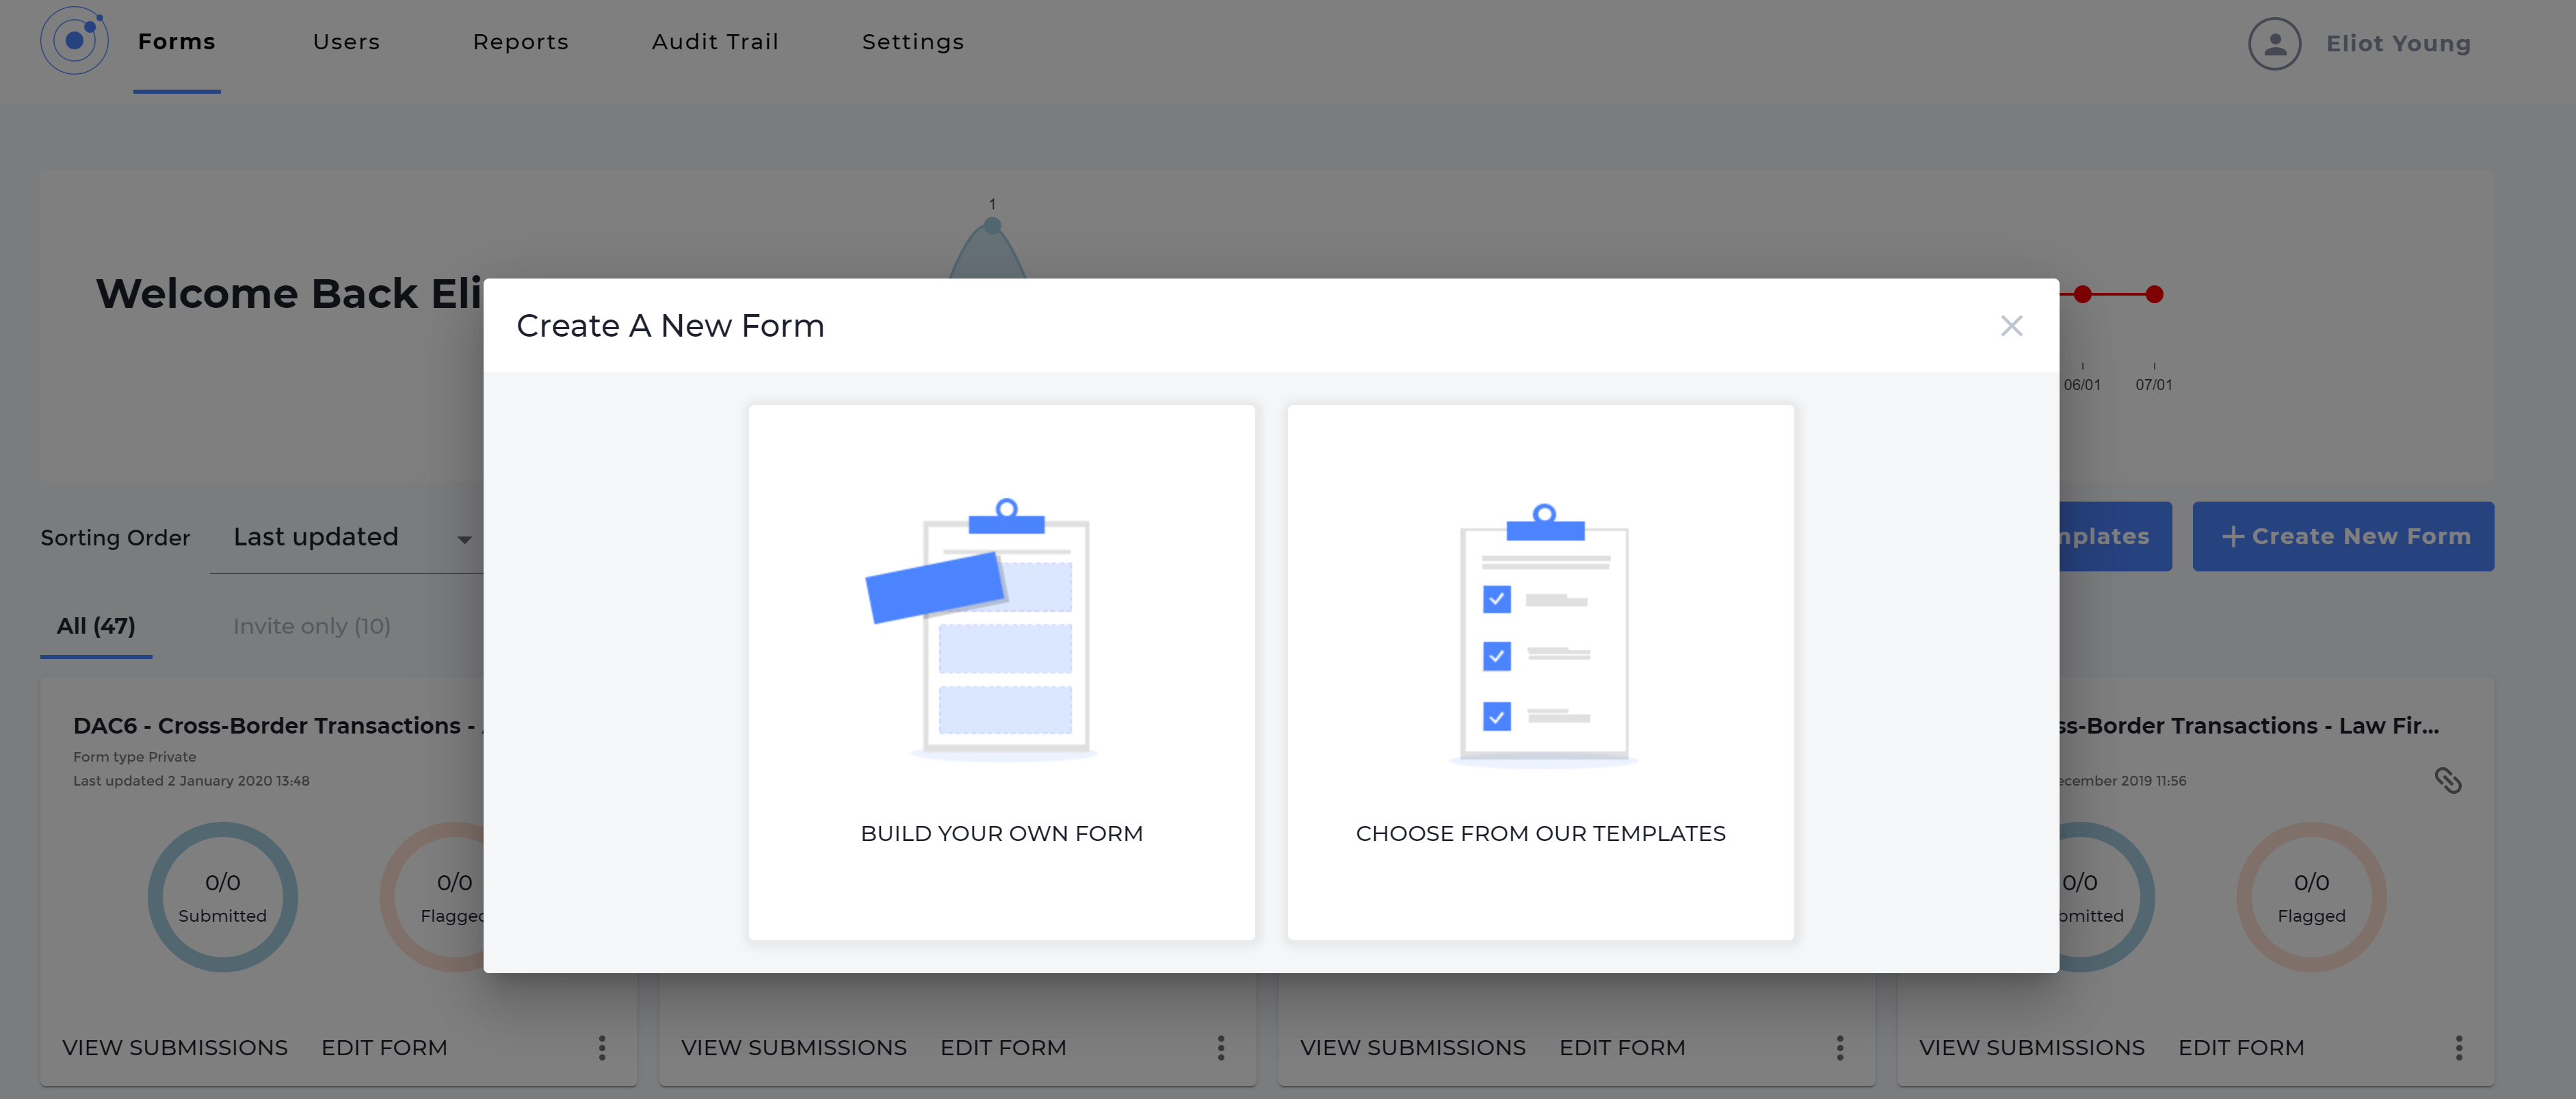
How to create a chart in 5 seconds
Creating a report is simple and takes just a few moments:
- On your dashboard, click on “Reports”
- Click on “Create a new report”
- Select the form you wish to create a report for from the list
- Select “Row” to create a new row and choose how many widgets you wish to appear in the row
- Choose the format you want the report to appear in, such as “Pie chart”
- Select which question in the form you wish to create a chart for. There is no limit to the amount of charts or graphs you can create for any single report.
The report stays up-to-date in real time and can be exported to a PDF at any time.
Want to learn more about Omnitrack and our other features? Complete the short form below and a member of our team will be in touch.