Version 2.01 of the Risk Management System includes many enhancements and built in reports.
New fields in the risk assessment process
We have added several new fields for risks: risk velocity, explanations for assessments, tolerance, further actions being considered, review date, and several new fields for controls: type, effectiveness score, effectiveness description, improvements being considered or pursued, review date.
![risk-assessment-fields [2]](https://vinciworks.vmdev.co.uk/wp-content/uploads/2024/05/risk-assessment-fields-2.png)
These new (optional) fields enable firms to create the advanced reports below.
New reports
Review date
Internal review and audit are key components of an effective enterprise risk management process. Each risk and each control in the Risk Management System can now have a review date that alerts risk and control owners to verify that the data is current.
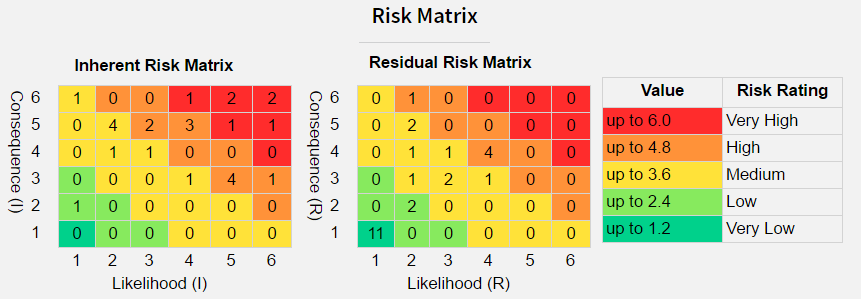
Risk appetite
Risk appetite is the amount and type of risk that an organization is willing to pursue or retain. Organisations will have different risk appetites depending on their sector, culture and objectives.
With the Risk Management System a firm can set a graphical representation of its appetite for its report and dashboard. Generally firms set the a residual score as their firmwide ‘appetite’. Scores below that number appear in green and above that number appear in yellow, amber and red.
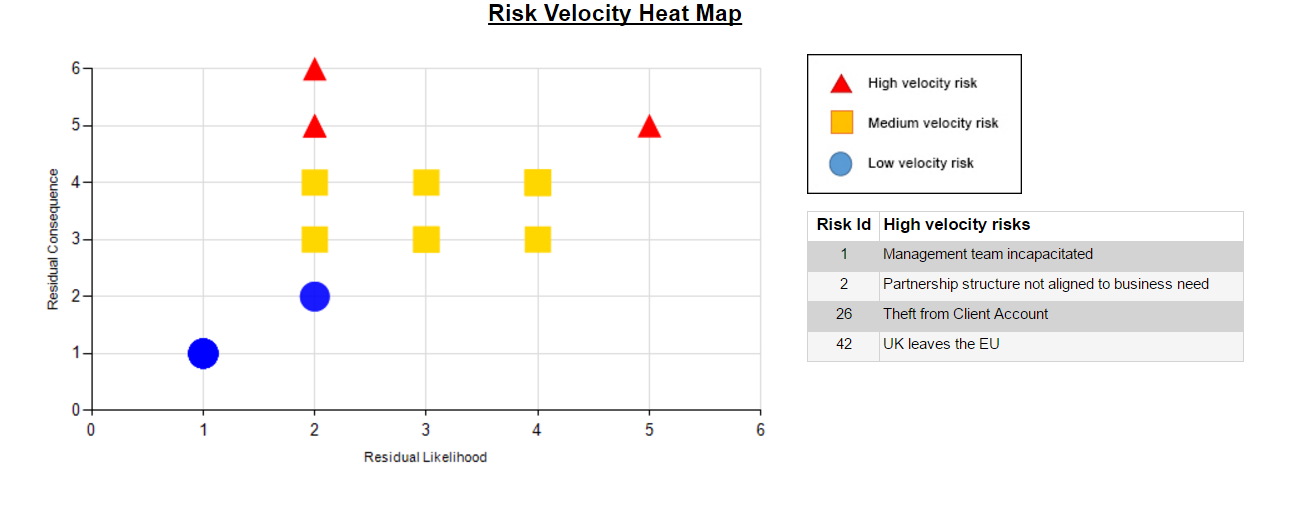
Risk velocity
Risk velocity is one of the newest measures in the field of enterprise risk management. It is defined as the amount of time before the full risk impact is felt, once a risk event occurs. This enables firms to understand what their response time will be after a risk event. Risks with a high velocity will leave very little or no time for reaction and response planning before serious consequences of the risk hit.
The Risk Velocity Heat Map enables decision makers to create rapid response plans for high velocity risks.
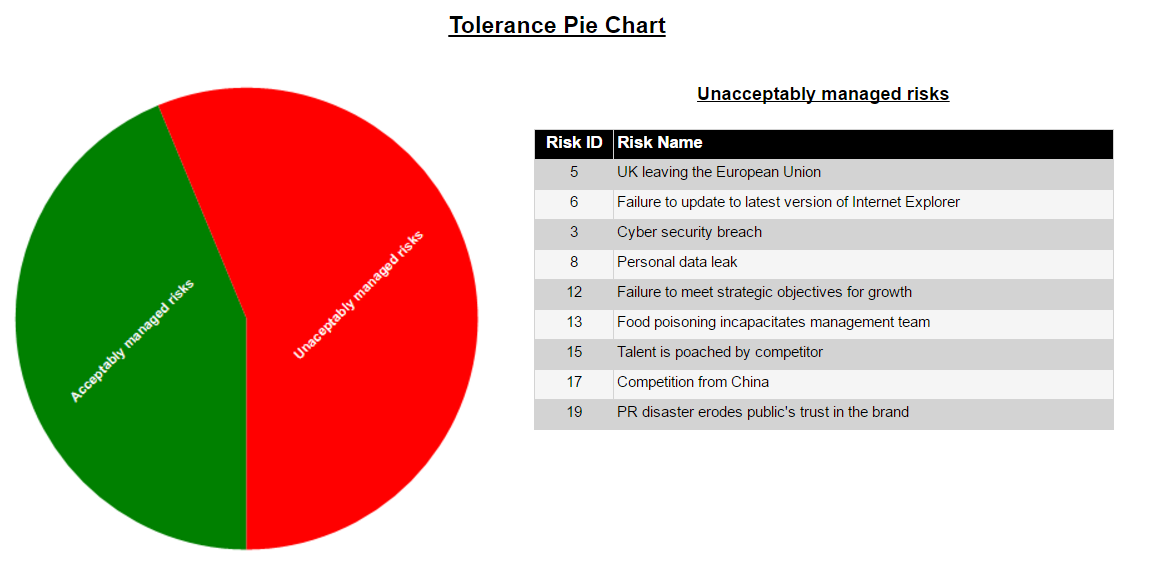
Risk tolerance
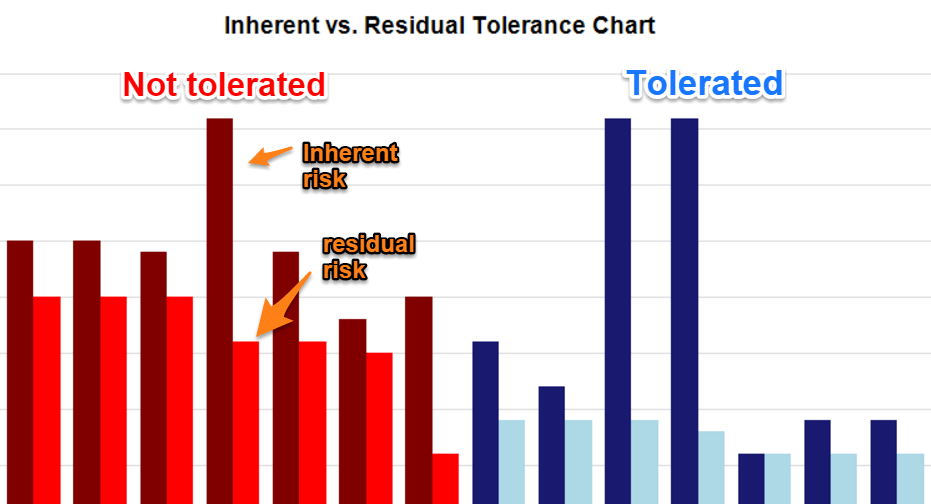
The risk tolerance is the organization or stakeholder’s readiness to bear the risk after risk treatment in order to achieve their objectives. Depending on the risk adjusted outcome, each risk might have a different tolerance level. The charts below demonstrate the type of reports you can generate in order to analyse your firm’s risk tolerance.
In the chart below a firm can see a list of all risks above the tolerance threshold.
In the next chart firms can see the inherent and residual scores along with tolerance levels. This demonstrates that there could be high scoring risks that are tolerated if they are in line with risk-adjusted objectives.